Coming Soon: Week Stock
Be warned, this app is more of a fun, experimental tech demo rather than a serious app meant to make actual stock decisions.

I’ve been dabbling in the stock market a bit lately and been having some good luck playing the SPY rallies for quick swing trades. I think this is a fairly well known strategy. It’s not like I stumbled into anything special, but the TLDR is:
Wait for the SPY to drop for 2-3 days in a row
Buy a few beaten up stocks near the end of the day
Pray that SPY rallies the next morning, lifting the market
Sell
I know playing oversold stocks during market rallies is pretty common, and there are dozens of indicators like RSI and MACD that work well with this strategy but, admittedly, I’m a bit of a newb there.
The only data points I’ve been caring about are:
The percent change at market close for a stock over the last X days
The percent change at market close for SPY over the last X days
I’d love to be able to aggregate these to get total % change over X span of days for both SPY and my stock
Surprisingly, these stats are actually hard to come by in most of the apps I’ve tried. I know you can glean this info from charts but those sort of blend the timeline together, I would love a hard break on market close.
This was a fun opportunity to make a quick app myself. It also gives me a chance to fiddle with some really crazy designs for a stock market app! For example, I wanted to design a stock app with no charts and no stock prices! The sheer insanity!
The Watchlist

For starters, getting real-time stock market data is ridiculously expensive but since I really only care about market close prices I can settle for a 15 minute delay in live stock prices. This delay actually makes things easier to implement. Instead of automatic timed refreshing on my watch list, I’ll just give the user a refresh button and they can refresh on demand.
As for the watch list, I wanted a way to show the user which stocks are more beat down than others. I opted to show watched stocks as bubbles… the more negative the stock has been recently, the bigger the bubble. I know, there are waaaaaaay more efficient and straight forward ways to show this than my falling bubble design (like a traditional heatmap) but what fun would that be? I also get to learn about integrating SpriteKit gaming physics (ie, dragging bubbles around the screen) into a SwiftUI app.
The biggest downside to this design is that, depending on the size of your phone, it really only works with smaller watch lists. Anything more than, like, a dozen stocks and the bubbles start pushing off screen. I personally have very small watchlists so this doesn’t really affect me much but I can imagine this being a deal breaker for others.
I’ll reveal the algorithm behind the bubble sizing in the app’s FAQ once it’s officially released.
The final part of the Home Screen is at the top, where it shows you current SPY data and a red/yellow/green stoplight to indicate market status. Yellow would be pre-market/after-hours, red is closed and green is obviously open. Unfortunately, I don’t have access to non-open market trades but this should be ok for now.
The Stock Details
Next up, when you drill down on a stock, what details do I want to show? Well, as I mentioned several times, I want to see the closing percent change of the stock for each of the last several market days and I want to see that in relation to SPY’s closing percent.
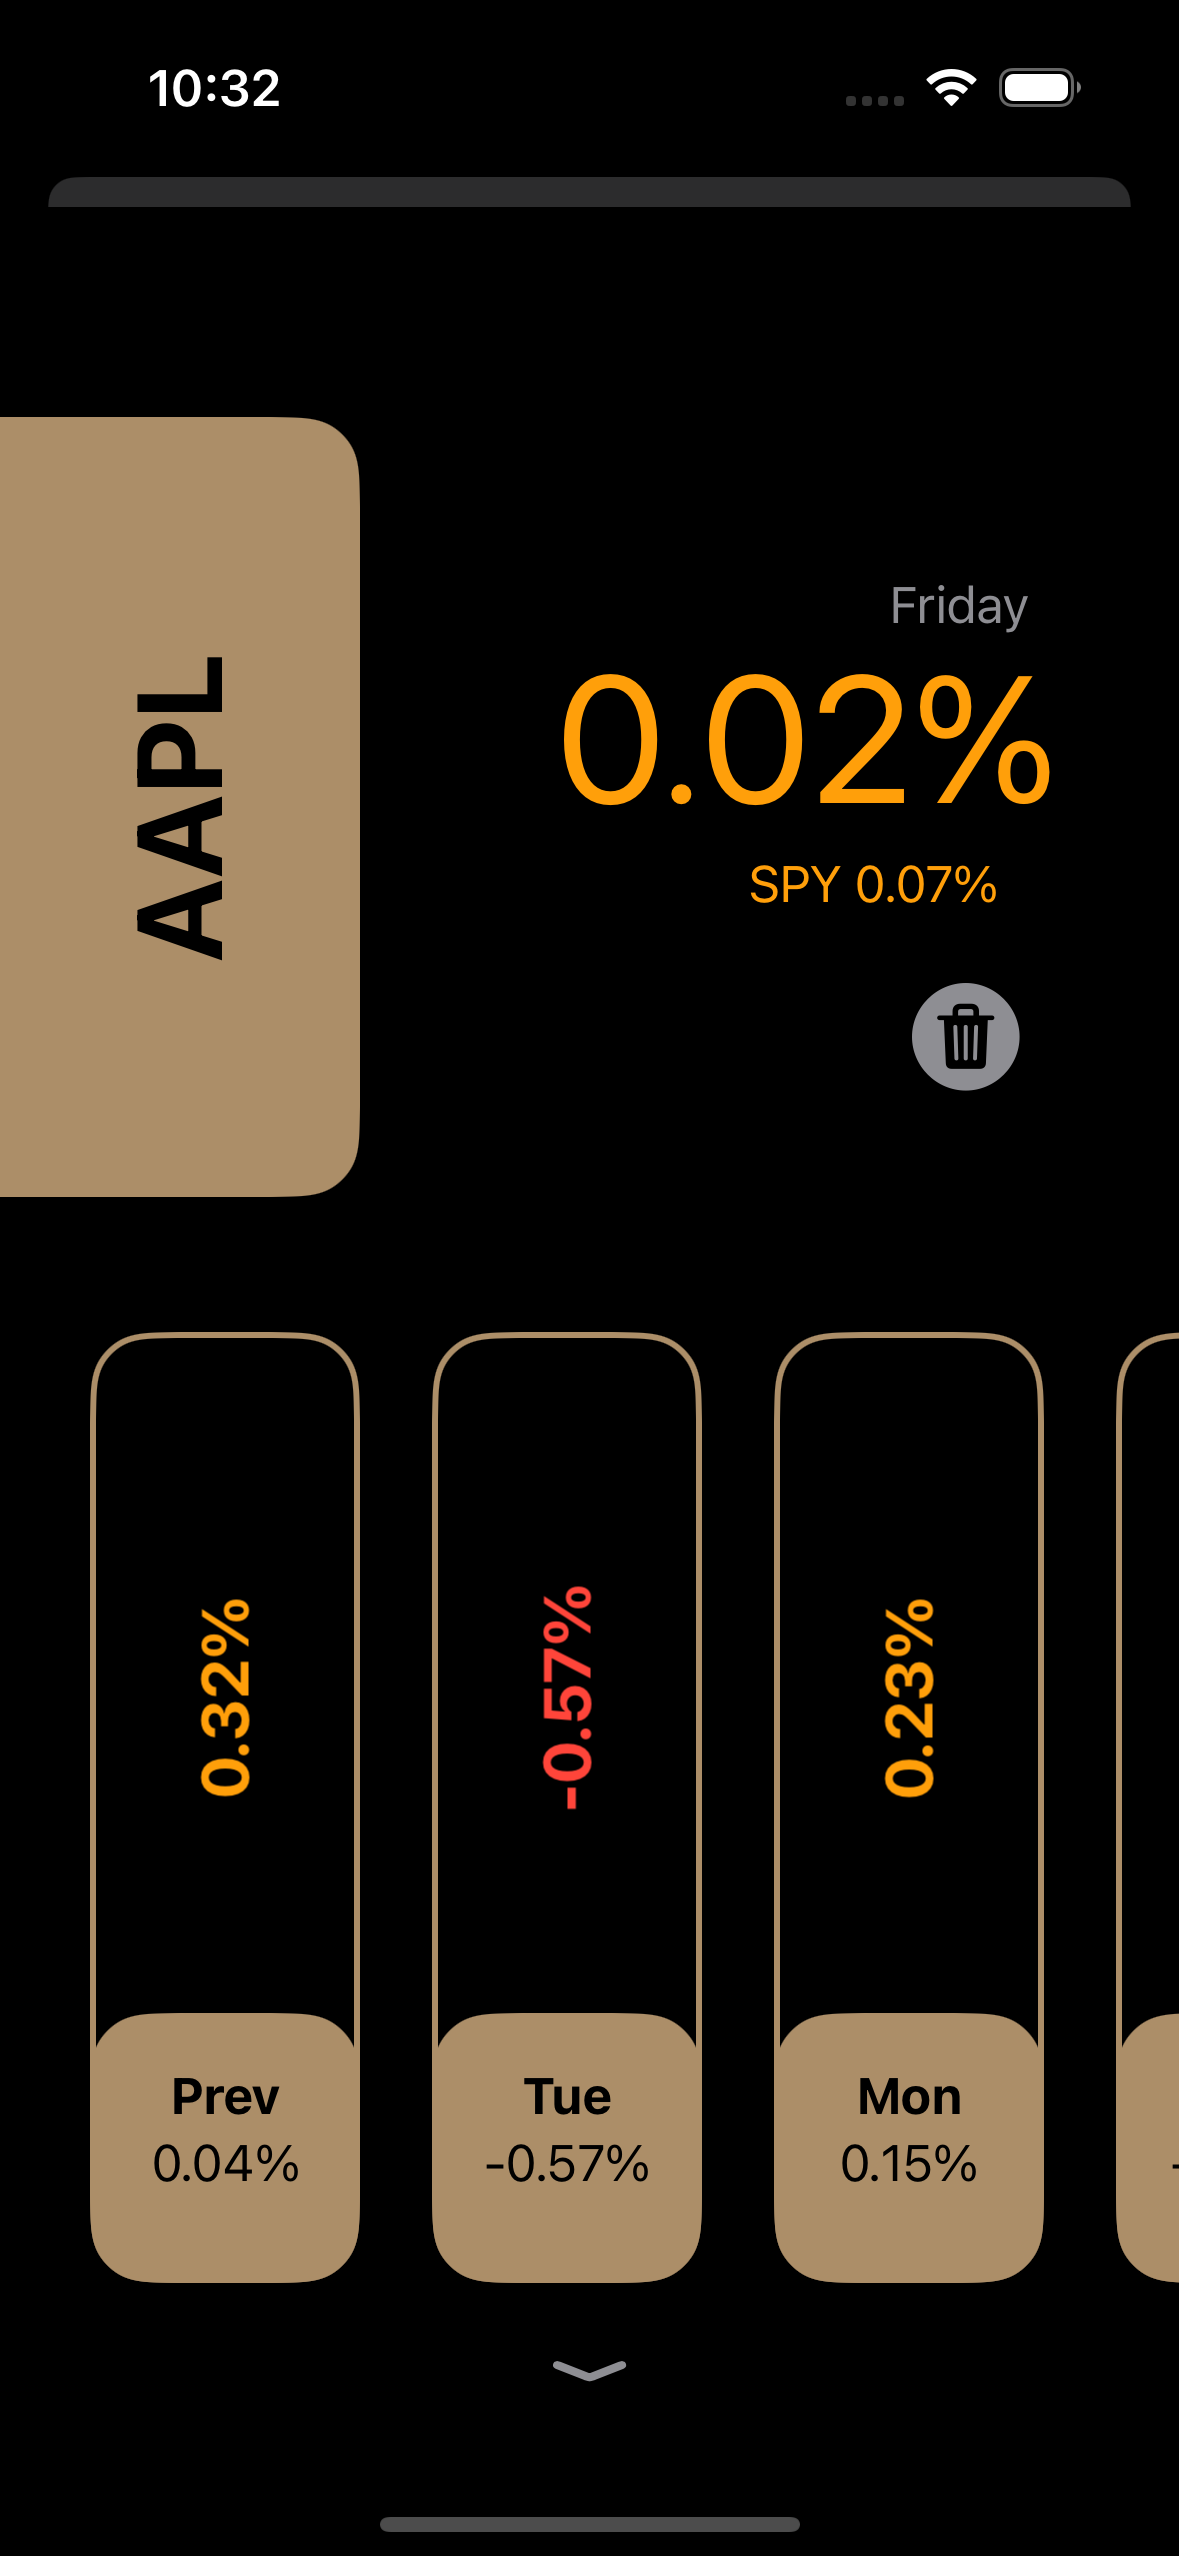
I also want to:
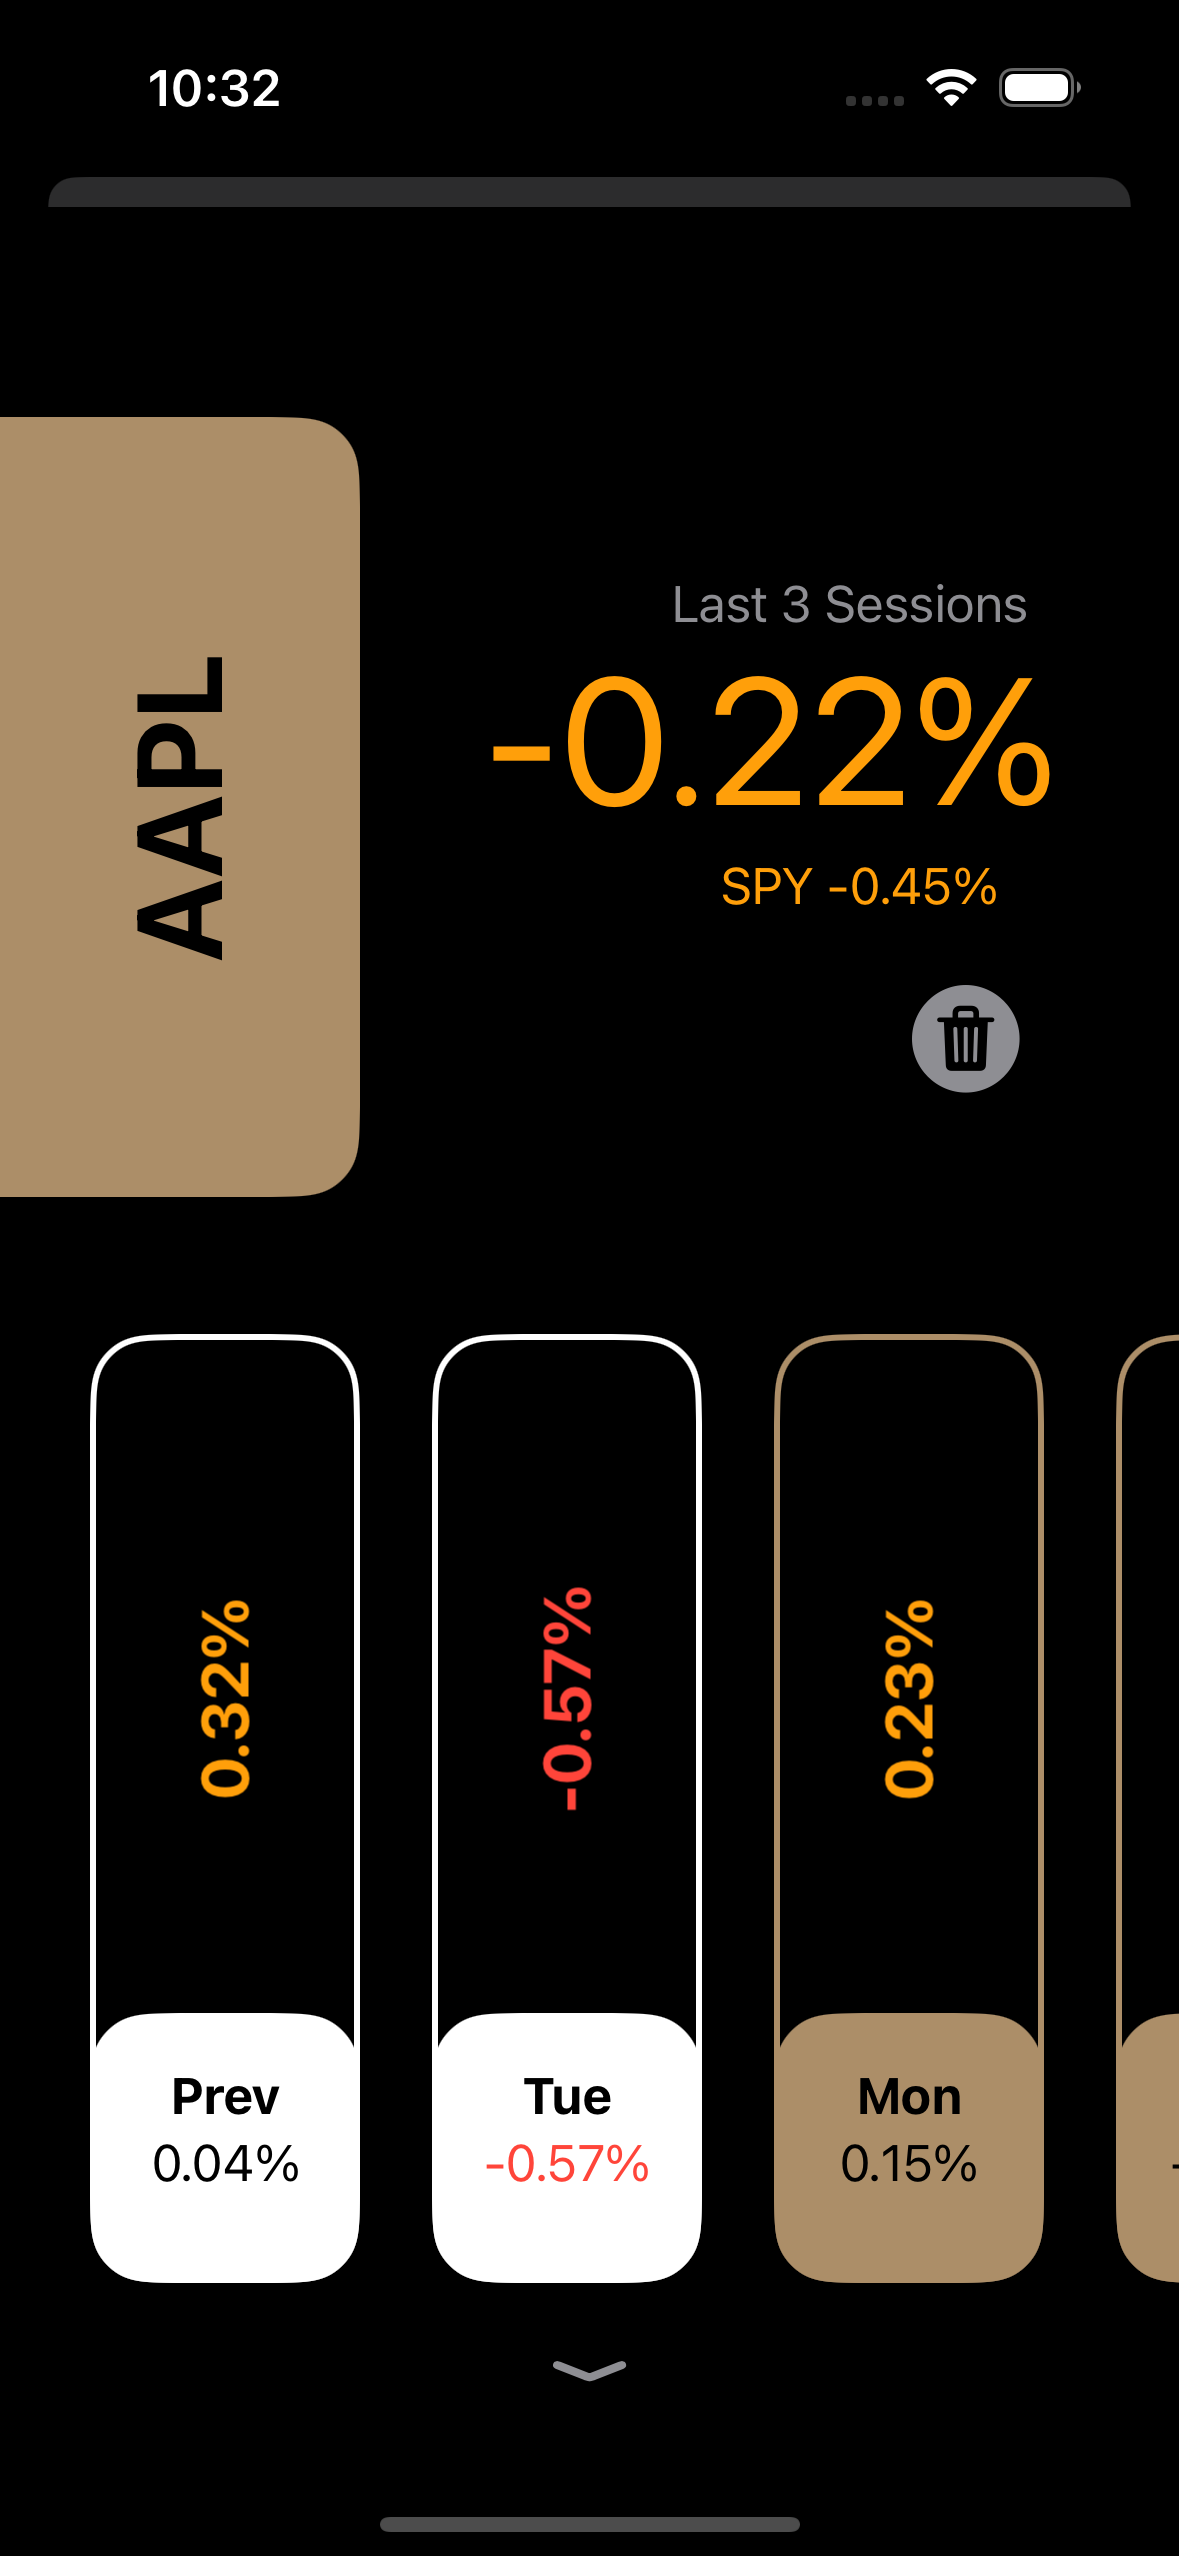
be able to pick a day in the past and aggregate the percent change for the stock and SPY since that day
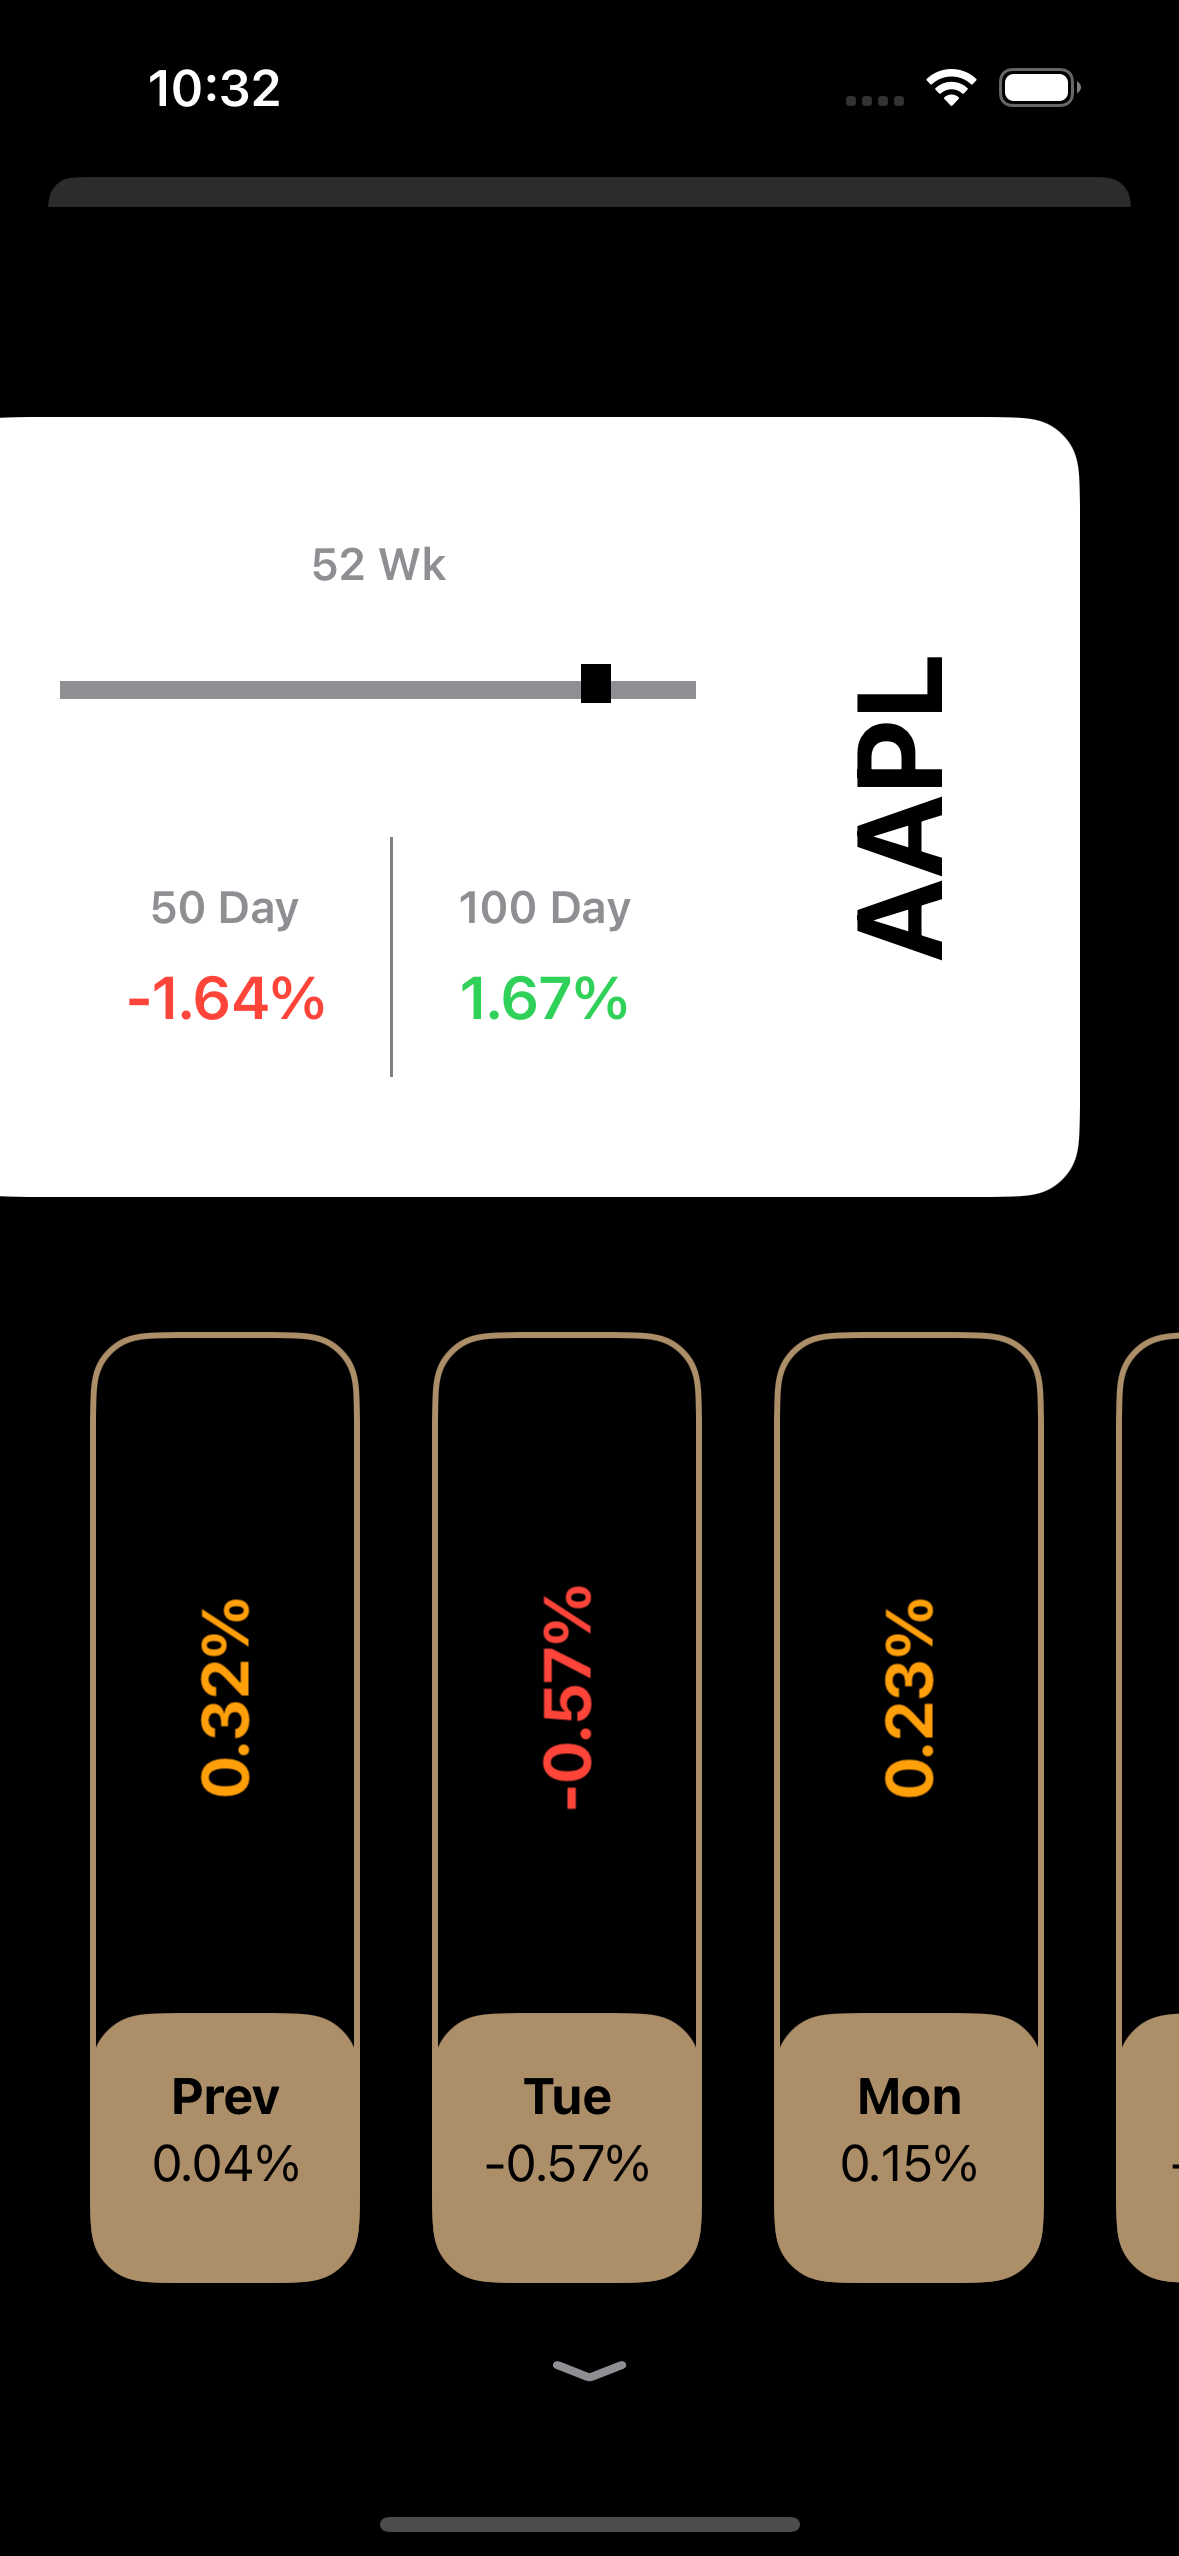
see a few data points that help me determine if a stock is oversold, like, 52 week range, current price in relation to 50 day and 100 day moving averages
see a non-interactive mini-chart for today’s market, just so i can see what direction things are currently trending
That’s it, nothing more, nothing less. The idea is that I use my app to look for buy signals then I pop open Robinhood or something to finalize the deal.
That’s why the app’s name is Week Stock (sort of a play on “Weak Sauce”), because I really only care about the what’s going on over the last week and… I guess… I’m looking for “weak” stocks, haha. I kill me. Anyways, naming things is not a talent of mine.
Dropped Features
One item I added to my app but ended up removing is the ability to see Top Losers for the day. While it made sense in theory… after all, I am trying to find something beaten up on a down SPY day to play into a SPY rally… it wasn’t very good in practice.
My app is meant to be really barebones… it doesn’t even show you the name of the stock (it assumes once you added it to your watchlist, you kinda know what you’re watching). With the Top Losers, many of these stocks I was unfamiliar with and I didn’t feel comfortable even following these without looking at the company name, description, debt, volume, latest news, etc.
To make Top Losers viable it meant converting my app to more of a full featured app and losing a bit of its quirkiness. Also, many other apps out there support Top Losers already so this feature wasn’t bringing anything new to the table.
Conclusion
The API I’m using is Polygon.io. I evaluated quite a few market APIs and this one had some of the best documentation, a really good range of API endpoints and was pretty affordable.
In the end, I’m having a blast working on this app and, as usual, my entire app library are just apps I make for myself and throw them on the App Store for free. Who knows, maybe someone else will find this useful.
I’m hoping to have v1 of this on the App Store in a 2-3 weeks.